Kitava is a Melanesian island that has maintained an almost entirely traditional, non-industrial diet until very recently. It was the subject of a study by Dr. Staffan Lindeberg and colleagues, which I have written about many times, in which they demonstrated that Kitavans have a very low (undetectable) rate of heart attack, stroke, diabetes and overweight. Dr. Lindeberg described their diet as consisting mostly of yam, sweet potato, taro, cassava, coconut, fruit, fish and vegetables. Over the seven days that Dr. Lindeberg measured food intake, they ate 69% of their calories as carbohydrate, 21% as fat (mostly from coconut) and 10% as protein.
I recently received an e-mail from a Kitavan by the name of Job Daniel. He's working at the Papua New Guinea Institute of Medical Research in Madang, studying the social and economic impacts of malaria and related health issues in Papua New Guinea. He recalls many details of Dr. Lindeberg's visit to Kitava, which Dr. Lindeberg has confirmed are correct. Job generously offered to answer some of my questions about the traditional Kitavan diet. My questions are in bold, and his responses are below.
How many meals a day do Kitavans eat?
People on the island eat mostly two meals a day. But nowadays, breakfast is mainly comprised of tubers (yam and sweet potato and greens all cooked in coconut cream and salt) and dinner is the same with the inclusion of fish as protein most often. In between these two meals, lunch is seen as a light refreshment with fruits or young coconut only to mention these two popular ones. In between the morning and the evening, we mostly eat fruits as snack or lunch. Generally speaking, there are only two main meals per day, i.e breakfast and dinner.
Do Kitavans eat any fermented food?
There are fermented fruits and nuts like you've said for breadfruit, nuts, yams and not forgetting fish. We ferment them by using the traditional method of drying them over the fire for months. And this fermented foods last for almost one to two years without getting stale or spoiled. Food preservation is a skill inherited from our great grand fathers taking into consideration the island's location and availability of food. Foods such as bread fruit and fish are fermented and preserved to serve as substitutes to fresh food in times of trouble or shortage. Otherwise, they're eaten along the way.
Is this really fermentation or simply drying?
To your query about the fermentation methods we use, apart from drying food over the fire, we also use this method like the Hawaiians do with taro [poi- SJG]. For our case we bury a special kind of fruit collected from the tree and buried in the ground to ripen, which takes about 2 - 3 days. I don't really know the English name, but we call it 'Natu' in vernecular. There's also a certain nut when it falls from the tree, women collect them and peel off the rotten skin, then mumu [earth oven- SJG] them in the ground covered with leaves to protect them from burning from the extreme heat of the fire, both from the open fire on top and hot stones underneath. After a day, the nuts are removed from the mumu and loaded into very big baskets which are then shifted to the sea for fermentation. This takes a week (minimum) to ferment or be ready for consumption at last. After the fermentation period is over, i.e one week some days or two
weeks to be exact, then the nuts are finally ready for eating. The length of time it takes before the nuts are no longer edible is roughly one week.
What parts of the fish are eaten?
As islanders, we eat almost every creature and body part of a sea creature. Especially fish eggs, it is one of the favorites of children. They always prefer it burnt on the fire and consumed greedily. Every part of the fish is eaten except for the feces, gall bladder, bones and the scales.
Is food shortage really rare on Kitava?
Generally speaking it is rare. BUT sometimes we run out of food only if there is a drought and the sea is useless. Otherwise, we tend to use the preserved or fermented foods on the dryer in the kitchen. As you would understand, we have seasons and they affect the type and availability of food on the island. In the beginning of the year, we eat sweet potato, cassava and mostly tuna for protein. During mid year, before yam comes in to replace sweet potato and cassava, taro is then ready for harvest. And then yams are ready for harvesting so the food supply is continued on. OK when yams are harvested, some are eaten, some are stored away for reserve and seedlings. In this way, we don't run out food towards the end of the year before sweet potato would be ready for harvest. So as you can see, the food supply on the island is somewhat planned by our ancestral economists where it continues throughout the year without stopping.
Do Kitavans traditionally eat pork, and if so, how often?
We do eat pork but not that often because pork meat is chiefly regarded important on the island. We only eat pork on special occasions so I'd rather say that pork is only eaten occasionally. In most cases in the middle of the year when the yams are harvested (yam harvest celebrations and towards the end of the year for certain rites and activities). Otherwise the everyday meal is always topped with fish.
How long are infants breast fed on Kitava?
Women breast feed for a minimum of 2 years. But breast feeding is again determined by the size and health situation of the baby. If the baby is looking healthy and big, it is most likely that this baby would be adopted temporarily by someone else so as to be removed from breast milk after two years of age minimum. Child care nowadays is paramount as people start to realize the importance of health and hygiene in general. But Kitavans are well known in that part of the country for their hygiene practices. They also got the provincial and district awards for a 'clean community' in early 90s and right now, they still maintain their hygiene level and awareness.
Are there any other foods that are commonly eaten on Kitava that I might not be aware of?
Bananas, pineapple, corn and watermelons. For watermelon and corn, they are plentiful especially at this time of the year.
Thanks for your help, Job! I know many people will appreciate reading these responses.
Sunday, 5 December 2010


Thursday, 2 December 2010
Diet-Heart Controlled Trials: a New Literature Review
Many controlled studies have measured the cardiovascular effects of replacing animal ("saturated") fats with seed oils (predominantly the omega-6 polyunsaturated fat linoleic acid) in humans. A number of these studies recorded heart attacks and total mortality during the following 1-8 years. Several investigators have done meta-analyses (literature reviews) to try to tease out overall conclusions from these studies.
I'm pleased to point out a new meta-analysis of these controlled trials by Dr. Christopher Ramsden and colleagues (1). This paper finally cleans up the mess that previous meta-analyses have made of the diet-heart literature. One recent paper in particular by Dr. Dariush Mozaffarian and colleagues concluded that overall, the controlled trials show that replacing animal fat with linoleic acid (LA)-rich seed oils reduces heart attack risk (2). I disagreed strongly with their conclusion because I felt their methods were faulty (3).
Dr. Ramsden and colleagues pointed out several fundamental flaws in the review paper by Dr. Mozaffarian and colleagues, as well as in the prevailing interpretation of these studies in the scientific literature in general. These overlap with the concerns that I voiced in my post (4):
What did they find?
The article also contains an excellent discussion of the Finnish mental hospital trial (5, 6) and why it was excluded from the meta-analysis, in which Dr. Ramsden and colleagues point out major design flaws, some of which I was not aware of. For example, trans fat intake was on average 13 times higher in the control groups than in the experimental groups. In addition, one of the control groups received more than twice as much of the antipsychotic drug thioridazine, which is known to be highly toxic to the heart, as any other group. Ouch. I'm glad to see this study finally discussed in an open and honest manner. I discussed my own problems with the Finnish trial in an earlier post (7).
I was also glad to see an open discussion of the Oslo Diet-heart study (8), in which diet changes led to a reduction in heart attack risk over five years. Dr. Mozaffarian and colleagues included it in their analysis as if it were a controlled trial in which animal fat was replaced by seed oils only. In reality, the investigators changed many variables at once, which I had also pointed out in my critique of Dr. Mozaffarian's meta-analysis (9). Here's what Dr. Ramsden and colleagues had to say about it:
One criticism I have of Dr. Ramsden's paper is that they used the Oslo trial in their analysis, despite the major limitation described above. However, they were extremely open about it and discussed the problem in detail. Furthermore, the overall result would have been essentially the same even if they had excluded the Oslo trial from the analysis.
Overall, the paper is an excellent addition to the literature, and I hope it will bring a new level of sophistication to the dialogue on dietary prevention of cardiovascular disease. In the meantime, brace yourselves for an avalanche of criticism from the seed oil brigade.
* Guidelines that determine which studies to include in the analysis. For example, you want to exclude any study that wasn't randomized, because it will not be interpretable from a statistical standpoint. You also want to exclude trials where major variables differ between groups besides the specific variable you're trying to test. The Finnish mental hospital trial fails by both criteria.
I'm pleased to point out a new meta-analysis of these controlled trials by Dr. Christopher Ramsden and colleagues (1). This paper finally cleans up the mess that previous meta-analyses have made of the diet-heart literature. One recent paper in particular by Dr. Dariush Mozaffarian and colleagues concluded that overall, the controlled trials show that replacing animal fat with linoleic acid (LA)-rich seed oils reduces heart attack risk (2). I disagreed strongly with their conclusion because I felt their methods were faulty (3).
Dr. Ramsden and colleagues pointed out several fundamental flaws in the review paper by Dr. Mozaffarian and colleagues, as well as in the prevailing interpretation of these studies in the scientific literature in general. These overlap with the concerns that I voiced in my post (4):
- Omission of unfavorable studies, including the Rose corn oil trial and the Sydney diet-heart trial.
- Inclusion of weak trials with major confounding variables, such as the Finnish mental hospital trial.
- Failure to distinguish between omega-6 and omega-3 fatty acids.
- Failure to acknowledge that seed oils often replaced large quantities of industrial trans fats in addition to animal fat in these trials.
What did they find?
- Interventions that replaced animal and trans fat with seed oils that were rich in LA but low in omega-3 caused a non-significant trend toward increased heart attacks (13% increase) and overall mortality.
- Interventions that replaced animal and trans fat with a combination of LA and omega-3 fats significantly reduced heart attacks (by 22%). The numbers for total mortality followed a similar trend.
...experimental diets replaced common ‘hard’ margarines, industrial shortenings and other sources of [trans fat] in all seven of the [controlled trials] included in the meta-analysis by Mozaffarian et al. The mean estimated [trans fat] content of the seven control diets was 3·0 [% of calories] (range 1·5–9·6 [%]).In other words, it looks like trans fat is probably the issue, not animal fat, but these trials replaced both simultaneously so we can't know for sure. I will note here that trans fat does not generally promote atherosclerosis (thickening and hardening of arteries) in animal models, so if it does truly increase heart attack risk as many studies suggest, it's probably through a mechanism that is independent of atherosclerosis.
...the displacement of [trans fat], rather than the substitution of mixed n-3/n-6 [polyunsaturated fat] for [saturated fat], may account for some or all of the 22% reduction in non-fatal [heart attacks and heart attack] death in our meta-analysis. By contrast, the increased [heart attack] risks from n-6 specific [polyunsaturated fat] diets in our meta-analysis may be underestimated as n-6 [polyunsaturated fat] also replaced substantial quantities of [trans fat] (Table 3). The consistent trends towards increased [heart attack] risk of n-6 specific [polyunsaturated fat] diets may have become significant if the n-6 [polyunsaturated fat] replaced only [saturated fat], instead of a combination of [saturated fat] and [trans fat].
The article also contains an excellent discussion of the Finnish mental hospital trial (5, 6) and why it was excluded from the meta-analysis, in which Dr. Ramsden and colleagues point out major design flaws, some of which I was not aware of. For example, trans fat intake was on average 13 times higher in the control groups than in the experimental groups. In addition, one of the control groups received more than twice as much of the antipsychotic drug thioridazine, which is known to be highly toxic to the heart, as any other group. Ouch. I'm glad to see this study finally discussed in an open and honest manner. I discussed my own problems with the Finnish trial in an earlier post (7).
I was also glad to see an open discussion of the Oslo Diet-heart study (8), in which diet changes led to a reduction in heart attack risk over five years. Dr. Mozaffarian and colleagues included it in their analysis as if it were a controlled trial in which animal fat was replaced by seed oils only. In reality, the investigators changed many variables at once, which I had also pointed out in my critique of Dr. Mozaffarian's meta-analysis (9). Here's what Dr. Ramsden and colleagues had to say about it:
First, experimental dieters were instructed to substitute fish, shellfish and ‘whale beef’ for meats and eggs, and were actually supplied with ‘considerable quantities of Norwegian sardines canned in cod liver oil, which proved to be popular as a bread spread’(32)... Second, the experimental group consumed massive amounts of soybean oil, which provided large quantities of both LA (15·6 en %) and ALA (2·7 en %). ALA consumption was about 4·5 times average US intake(42), or about twelve typical flax oil pills (1 g pill ¼ 560 mg ALA) per d. In addition, the fish and cod liver oil consumption provided Oslo (598N latitude) dieters with 610 IU (15·25 mg) of daily vitamin D3, recently linked to lower blood pressure, plaque stabilisation, and reduced [heart attack risk] (64). Furthermore, experimental dieters were encouraged to eat more nuts, fruits, and vegetables; to limit animal fats; and to restrict their intake of refined grains and sugar.trans fat intake was also reduced substantially by excluding margarine in the experimental group. Other review papers have used this trial as a justification to replace animal fat with seed oils. Hmm... The only reason they get away with this is because the trial was published in 1966 and almost no one today has actually read it.
One criticism I have of Dr. Ramsden's paper is that they used the Oslo trial in their analysis, despite the major limitation described above. However, they were extremely open about it and discussed the problem in detail. Furthermore, the overall result would have been essentially the same even if they had excluded the Oslo trial from the analysis.
Overall, the paper is an excellent addition to the literature, and I hope it will bring a new level of sophistication to the dialogue on dietary prevention of cardiovascular disease. In the meantime, brace yourselves for an avalanche of criticism from the seed oil brigade.
* Guidelines that determine which studies to include in the analysis. For example, you want to exclude any study that wasn't randomized, because it will not be interpretable from a statistical standpoint. You also want to exclude trials where major variables differ between groups besides the specific variable you're trying to test. The Finnish mental hospital trial fails by both criteria.
Sponsored by:
How lean should one be?
Loss of muscle mass is associated with aging. It is also associated with the metabolic syndrome, together with excessive body fat gain. It is safe to assume that having low muscle and high fat mass, at the same time, is undesirable.
The extreme opposite of that, achievable though natural means, would be to have as much muscle as possible and as low body fat as possible. People who achieve that extreme often look a bit like “buff skeletons”.
This post assumes that increasing muscle mass through strength training and proper nutrition is healthy. It looks into body fat levels, specifically how low body fat would have to be for health to be maximized.
I am happy to acknowledge that quite often I am working on other things and then become interested in a topic that is brought up by Richard Nikoley, and discussed by his readers (I am one of them). This post is a good example of that.
Obesity and the diseases of civilization
Obesity is strongly associated with the diseases of civilization, of which the prototypical example is perhaps type 2 diabetes. So much so that sometimes the impression one gets is that without first becoming obese, one cannot develop any of the diseases of civilization.
But this is not really true. For example, diabetes type 1 is also one of the diseases of civilization, and it often strikes thin people. Diabetes type 1 results from the destruction of the beta cells in the pancreas by a person’s own immune system. The beta cells in the pancreas produce insulin, which regulates blood glucose levels.
Still, obesity is undeniably a major risk factor for the diseases of civilization. It seems reasonable to want to move away from it. But how much? How lean should one be to be as healthy as possible? Given the ubiquity of U-curve relationships among health variables, there should be a limit below which health starts deteriorating.
Is the level of body fat of the gentleman on the photo below (from: ufcbettingtoday.com) low enough? His name is Fedor; more on him below. I tend to admire people who excel in narrow fields, be they intellectual or sport-related, even if I do not do anything remotely similar in my spare time. I admire Fedor.

Let us look at some research and anecdotal evidence to see if we can answer the question above.
The buff skeleton look is often perceived as somewhat unattractive
Being in the minority is not being wrong, but should make one think. Like Richard Nikoley’s, my own perception of the physique of men and women is that, the leaner they are, the better; as long as they also have a reasonable amount of muscle. That is, in my mind, the look of a stage-ready competitive natural bodybuilder is close to the healthiest look possible.
The majority’s opinion, however, seems different, at least anecdotally. The majority of women that I hear or read voicing their opinions on this matter seem to find the “buff skeleton” look somewhat unattractive, compared with a more average fit or athletic look. The same seems to be true for perceptions of males about females.
A little side note. From an evolutionary perspective, perceptions of ancestral women about men must have been much more important than perceptions of ancestral men about women. The reason is that the ancestral women were the ones applying sexual selection pressures in our ancestral past.
For the sake of discussion, let us define the buff skeleton look as one of a reasonably muscular person with a very low body fat percentage; pretty much only essential fat. That would be 10-13 percent for women, and 5-8 percent for men.
The average fit look would be 21-24 percent for women, and 14-17 percent for men. Somewhere in between, would be what we could call the athletic look, namely 14-20 percent for women, and 6-13 percent for men. These levels are exactly the ones posted on this Wikipedia article on body fat percentages, at the time of writing.
From an evolutionary perspective, attractiveness to members of the opposite sex should be correlated with health. Unless we are talking about a costly trait used in sexual selection by our ancestors; something analogous to the male peacock’s train.
But costly traits are usually ornamental, and are often perceived as attractive even in exaggerated forms. What prevents male peacock trains from becoming the size of a mountain is that they also impair survival. Otherwise they would keep growing. The peahens find them sexy.
Being ripped is not always associated with better athletic performance
Then there is the argument that if you carried some extra fat around the waist, then you would not be able to fight, hunt etc. as effectively as you could if you were living 500,000 years ago. Evolution does not “like” that, so it is an unnatural and maladaptive state achieved by modern humans.
Well, certainly the sport of mixed martial arts (MMA) is not the best point of comparison for Paleolithic life, but it is not such a bad model either. Look at this photo of Fedor Emelianenko (on the left, clearly not so lean) next to Andrei Arlovski (fairly lean). Fedor is also the one on the photo at the beginning of this post.
Fedor weighed about 220 lbs at 6’; Arlovski 250 lbs at 6’4’’. In fact, Arlovski is one of the leanest and most muscular MMA heavyweights, and also one of the most highly ranked. Now look at Fedor in action (see this YouTube video), including what happened when Fedor fought Arlovski, at around the 4:28 mark. Fedor won by knockout.
Both Fedor and Arlovski are heavyweights; which means that they do not have to “make weight”. That is, they do not have to lose weight to abide by the regulations of their weight category. Since both are professional MMA fighters, among the very best in the world, the weight at which they compete is generally the weight that is associated with their best performance.
Fedor was practically unbeaten until recently, even though he faced a very high level of competition. Before Fedor there was another professional fighter that many thought was from Russia, and who ruled the MMA heavyweight scene for a while. His name is Igor Vovchanchyn, and he is from the Ukraine. At 5’8’’ and 230 lbs in his prime, he was a bit chubby. This YouTube video shows him in action; and it is brutal.
A BMI of about 25 seems to be the healthiest for long-term survival
Then we have this post by Stargazey, a blogger who likes science. Toward the end the post she discusses a study suggesting that a body mass index (BMI) of about 25 seems to be the healthiest for long-term survival. That BMI is between normal weight and overweight. The study suggests that both being underweight or obese is unhealthy, in terms of long-term survival.
The BMI is calculated as an individual’s body weight divided by the square of the individual’s height. A limitation of its use here is that the BMI is a more reliable proxy for body fat percentage for women than for men, and can be particularly misleading when applied to muscular men.
The traditional Okinawans are not super lean
The traditional Okinawans (here is a good YouTube video) are the longest living people in the world. Yet, they are not super lean, not even close. They are not obese either. The traditional Okinawans are those who kept to their traditional diet and lifestyle, which seems to be less and less common these days.
There are better videos on the web that could be used to illustrate this point. Some even showing shirtless traditional karate instructors and students from Okinawa, which I had seen before but could not find again. Nearly all of those karate instructors and students were a bit chubby, but not obese. By the way, karate was invented in Okinawa.
The fact that the traditional Okinawans are not ripped does not mean that the level of fat that is healthy for them is also healthy for someone with a different genetic makeup. It is important to remember that the traditional Okinawans share a common ancestry.
What does this all mean?
Some speculation below, but before that let me tell this: as counterintuitive as it may sound, excessive abdominal fat may be associated with higher insulin sensitivity in some cases. This post discusses a study in which the members of a treatment group were more insulin sensitive than the members of a control group, even though the former were much fatter; particularly in terms of abdominal fat.
It is possible that the buff skeleton look is often perceived as somewhat unattractive because of cultural reasons, and that it is associated with the healthiest state for humans. However, it seems a bit unlikely that this applies as a general rule to everybody.
Another possibility, which appears to be more reasonable, is that the buff skeleton look is healthy for some, and not for others. After all, body fat percentage, like fat distribution, seems to be strongly influenced by our genes. We can adapt in ways that go against genetic pressures, but that may be costly in some cases.
There is a great deal of genetic variation in the human species, and much of it may be due to relatively recent evolutionary pressures.
Life is not that simple!
References
Buss, D.M. (1995). The evolution of desire: Strategies of human mating. New York, NY: Basic Books.
Cartwright, J. (2000). Evolution and human behavior: Darwinian perspectives on human nature. Cambridge, MA: The MIT Press.
Miller, G.F. (2000). The mating mind: How sexual choice shaped the evolution of human nature. New York, NY: Doubleday.
Zahavi, A. & Zahavi, A. (1997). The Handicap Principle: A missing piece of Darwin’s puzzle. Oxford, England: Oxford University Press.
The extreme opposite of that, achievable though natural means, would be to have as much muscle as possible and as low body fat as possible. People who achieve that extreme often look a bit like “buff skeletons”.
This post assumes that increasing muscle mass through strength training and proper nutrition is healthy. It looks into body fat levels, specifically how low body fat would have to be for health to be maximized.
I am happy to acknowledge that quite often I am working on other things and then become interested in a topic that is brought up by Richard Nikoley, and discussed by his readers (I am one of them). This post is a good example of that.
Obesity and the diseases of civilization
Obesity is strongly associated with the diseases of civilization, of which the prototypical example is perhaps type 2 diabetes. So much so that sometimes the impression one gets is that without first becoming obese, one cannot develop any of the diseases of civilization.
But this is not really true. For example, diabetes type 1 is also one of the diseases of civilization, and it often strikes thin people. Diabetes type 1 results from the destruction of the beta cells in the pancreas by a person’s own immune system. The beta cells in the pancreas produce insulin, which regulates blood glucose levels.
Still, obesity is undeniably a major risk factor for the diseases of civilization. It seems reasonable to want to move away from it. But how much? How lean should one be to be as healthy as possible? Given the ubiquity of U-curve relationships among health variables, there should be a limit below which health starts deteriorating.
Is the level of body fat of the gentleman on the photo below (from: ufcbettingtoday.com) low enough? His name is Fedor; more on him below. I tend to admire people who excel in narrow fields, be they intellectual or sport-related, even if I do not do anything remotely similar in my spare time. I admire Fedor.

Let us look at some research and anecdotal evidence to see if we can answer the question above.
The buff skeleton look is often perceived as somewhat unattractive
Being in the minority is not being wrong, but should make one think. Like Richard Nikoley’s, my own perception of the physique of men and women is that, the leaner they are, the better; as long as they also have a reasonable amount of muscle. That is, in my mind, the look of a stage-ready competitive natural bodybuilder is close to the healthiest look possible.
The majority’s opinion, however, seems different, at least anecdotally. The majority of women that I hear or read voicing their opinions on this matter seem to find the “buff skeleton” look somewhat unattractive, compared with a more average fit or athletic look. The same seems to be true for perceptions of males about females.
A little side note. From an evolutionary perspective, perceptions of ancestral women about men must have been much more important than perceptions of ancestral men about women. The reason is that the ancestral women were the ones applying sexual selection pressures in our ancestral past.
For the sake of discussion, let us define the buff skeleton look as one of a reasonably muscular person with a very low body fat percentage; pretty much only essential fat. That would be 10-13 percent for women, and 5-8 percent for men.
The average fit look would be 21-24 percent for women, and 14-17 percent for men. Somewhere in between, would be what we could call the athletic look, namely 14-20 percent for women, and 6-13 percent for men. These levels are exactly the ones posted on this Wikipedia article on body fat percentages, at the time of writing.
From an evolutionary perspective, attractiveness to members of the opposite sex should be correlated with health. Unless we are talking about a costly trait used in sexual selection by our ancestors; something analogous to the male peacock’s train.
But costly traits are usually ornamental, and are often perceived as attractive even in exaggerated forms. What prevents male peacock trains from becoming the size of a mountain is that they also impair survival. Otherwise they would keep growing. The peahens find them sexy.
Being ripped is not always associated with better athletic performance
Then there is the argument that if you carried some extra fat around the waist, then you would not be able to fight, hunt etc. as effectively as you could if you were living 500,000 years ago. Evolution does not “like” that, so it is an unnatural and maladaptive state achieved by modern humans.
Well, certainly the sport of mixed martial arts (MMA) is not the best point of comparison for Paleolithic life, but it is not such a bad model either. Look at this photo of Fedor Emelianenko (on the left, clearly not so lean) next to Andrei Arlovski (fairly lean). Fedor is also the one on the photo at the beginning of this post.
Fedor weighed about 220 lbs at 6’; Arlovski 250 lbs at 6’4’’. In fact, Arlovski is one of the leanest and most muscular MMA heavyweights, and also one of the most highly ranked. Now look at Fedor in action (see this YouTube video), including what happened when Fedor fought Arlovski, at around the 4:28 mark. Fedor won by knockout.
Both Fedor and Arlovski are heavyweights; which means that they do not have to “make weight”. That is, they do not have to lose weight to abide by the regulations of their weight category. Since both are professional MMA fighters, among the very best in the world, the weight at which they compete is generally the weight that is associated with their best performance.
Fedor was practically unbeaten until recently, even though he faced a very high level of competition. Before Fedor there was another professional fighter that many thought was from Russia, and who ruled the MMA heavyweight scene for a while. His name is Igor Vovchanchyn, and he is from the Ukraine. At 5’8’’ and 230 lbs in his prime, he was a bit chubby. This YouTube video shows him in action; and it is brutal.
A BMI of about 25 seems to be the healthiest for long-term survival
Then we have this post by Stargazey, a blogger who likes science. Toward the end the post she discusses a study suggesting that a body mass index (BMI) of about 25 seems to be the healthiest for long-term survival. That BMI is between normal weight and overweight. The study suggests that both being underweight or obese is unhealthy, in terms of long-term survival.
The BMI is calculated as an individual’s body weight divided by the square of the individual’s height. A limitation of its use here is that the BMI is a more reliable proxy for body fat percentage for women than for men, and can be particularly misleading when applied to muscular men.
The traditional Okinawans are not super lean
The traditional Okinawans (here is a good YouTube video) are the longest living people in the world. Yet, they are not super lean, not even close. They are not obese either. The traditional Okinawans are those who kept to their traditional diet and lifestyle, which seems to be less and less common these days.
There are better videos on the web that could be used to illustrate this point. Some even showing shirtless traditional karate instructors and students from Okinawa, which I had seen before but could not find again. Nearly all of those karate instructors and students were a bit chubby, but not obese. By the way, karate was invented in Okinawa.
The fact that the traditional Okinawans are not ripped does not mean that the level of fat that is healthy for them is also healthy for someone with a different genetic makeup. It is important to remember that the traditional Okinawans share a common ancestry.
What does this all mean?
Some speculation below, but before that let me tell this: as counterintuitive as it may sound, excessive abdominal fat may be associated with higher insulin sensitivity in some cases. This post discusses a study in which the members of a treatment group were more insulin sensitive than the members of a control group, even though the former were much fatter; particularly in terms of abdominal fat.
It is possible that the buff skeleton look is often perceived as somewhat unattractive because of cultural reasons, and that it is associated with the healthiest state for humans. However, it seems a bit unlikely that this applies as a general rule to everybody.
Another possibility, which appears to be more reasonable, is that the buff skeleton look is healthy for some, and not for others. After all, body fat percentage, like fat distribution, seems to be strongly influenced by our genes. We can adapt in ways that go against genetic pressures, but that may be costly in some cases.
There is a great deal of genetic variation in the human species, and much of it may be due to relatively recent evolutionary pressures.
Life is not that simple!
References
Buss, D.M. (1995). The evolution of desire: Strategies of human mating. New York, NY: Basic Books.
Cartwright, J. (2000). Evolution and human behavior: Darwinian perspectives on human nature. Cambridge, MA: The MIT Press.
Miller, G.F. (2000). The mating mind: How sexual choice shaped the evolution of human nature. New York, NY: Doubleday.
Zahavi, A. & Zahavi, A. (1997). The Handicap Principle: A missing piece of Darwin’s puzzle. Oxford, England: Oxford University Press.
Sponsored by:
Monday, 29 November 2010
Choline and Fatty Liver
I've been writing about non-alcoholic fatty liver disorder (NAFLD) since the early days of this blog, because it's an alarmingly common disorder (roughly a quarter of Americans affected) that is typically undiagnosed. It often progresses into its more serious cousin non-alcoholic steatohepatitis (NASH), an inflammatory condition that causes liver damage and can progress to cancer. In a number of previous posts, I pinpointed excess sugar and seed oil consumption as culprits in NAFLD and NASH (1, 2, 3, 4, 5).
Chris Masterjohn recently published two very informative posts on NAFLD/NASH that add a major additional factor to the equation: choline (6, 7). Choline is an essential nutrient that's required for the transport of fat out of the liver (8). NAFLD can be caused, and cured, simply by removing or adding dietary choline, and it appears to be dominant over other dietary factors including fat, sugar and alcohol. Apparently, certain researchers have been aware of this for some time, but it hasn't entered into the mainstream consciousness.
Could that be because the richest dietary sources are liver and eggs*? Choline is also found in smaller amounts in a variety of whole animal and plant foods. Most people don't get the officially recommended amount. From a recent review article (9):
Head over to Chris's blog and read about the classic studies he unearthed. And add The Daily Lipid to your RSS reader, because there's more interesting material to come!
The Sweet Truth about Liver and Egg Yolks
Does Choline Deficiency Contribute to Fatty Liver in Humans?
* For the brave: brain is actually the richest source of choline.
Chris Masterjohn recently published two very informative posts on NAFLD/NASH that add a major additional factor to the equation: choline (6, 7). Choline is an essential nutrient that's required for the transport of fat out of the liver (8). NAFLD can be caused, and cured, simply by removing or adding dietary choline, and it appears to be dominant over other dietary factors including fat, sugar and alcohol. Apparently, certain researchers have been aware of this for some time, but it hasn't entered into the mainstream consciousness.
Could that be because the richest dietary sources are liver and eggs*? Choline is also found in smaller amounts in a variety of whole animal and plant foods. Most people don't get the officially recommended amount. From a recent review article (9):
Mean choline intakes for older children, men, women, and pregnant women are far below the adequate intake level established by the [Institute of Medicine]. Given the importance of choline in a wide range of critical functions in the human body, coupled with less-than-optimal intakes among the population, dietary guidance should be developed to encourage the intake of choline-rich foods.I've dubbed beef liver the Most Nutritious Food in the World, Nature's Multivitamin, and I'll probably invent other titles for it in the future. Add yours to the comments.
Head over to Chris's blog and read about the classic studies he unearthed. And add The Daily Lipid to your RSS reader, because there's more interesting material to come!
The Sweet Truth about Liver and Egg Yolks
Does Choline Deficiency Contribute to Fatty Liver in Humans?
* For the brave: brain is actually the richest source of choline.
Sponsored by:
Sunday, 28 November 2010
HealthCorrelator for Excel 1.0 (HCE): Call for beta testers
This call is closed. Beta testing has been successfully completed. HealthCorrelator for Excel (HCE) is now publicly available for download and use on a free trial basis. For those users who decide to buy it after trying, licenses are available for individuals and organizations.
To download a free trial version – as well as get the User Manual, view demo YouTube videos, and download and try sample datasets – visit the HealthCorrelator.com web site.
To download a free trial version – as well as get the User Manual, view demo YouTube videos, and download and try sample datasets – visit the HealthCorrelator.com web site.
Sponsored by:
Monday, 22 November 2010
Human traits are distributed along bell curves: You need to know yourself, and HCE can help
Most human traits (e.g., body fat percentage, blood pressure, propensity toward depression) are influenced by our genes; some more than others. The vast majority of traits are also influenced by environmental factors, the “nurture” part of the “nature-nurture” equation. Very few traits are “innate”, such as blood type.
This means that manipulating environmental factors, such as diet and lifestyle, can strongly influence how the traits are finally expressed in humans. But each individual tends to respond differently to diet and lifestyle changes, because each individual is unique in terms of his or her combination of “nature” and “nurture”. Even identical twins are different in that respect.
When plotted, traits that are influenced by our genes are distributed along a bell-shaped curve. For example, a trait like body fat percentage, when measured in a population of 1000 individuals, will yield a distribution of values that will look like a bell-shaped distribution. This type of distribution is also known in statistics as a “normal” distribution.
Why is that?
The additive effect of genes and the bell curve
The reason is purely mathematical. A measurable trait, like body fat percentage, is usually influenced by several genes. (Sometimes individual genes have a very marked effect, as in genes that “switch on or off” other genes.) Those genes appear at random in a population, and their various combinations spread in response to selection pressures. Selection pressures usually cause a narrowing of the bell-shaped curve distributions of traits in populations.
The genes interact with environmental influences, which also have a certain degree of randomness. The result is a massive combined randomness. It is this massive randomness that leads to the bell-curve distribution. The bell curve itself is not random at all, which is a fascinating aspect of this phenomenon. From “chaos” comes “order”. A bell curve is a well-defined curve that is associated with a function, the probability density function.
The underlying mathematical reason for the bell shape is the central limit theorem. The genes are combined in different individuals as combinations of alleles, where each allele is a variation (or mutation) of a gene. An allele set, for genes in different locations of the human DNA, forms a particular allele combination, called a genotype. The alleles combine their effects, usually in an additive fashion, to influence a trait.
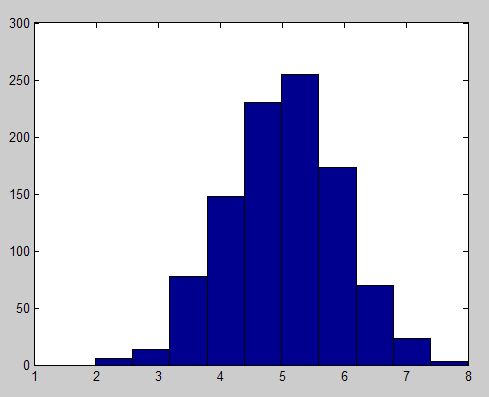
Here is a simple illustration. Let us say one generates 1000 random variables, each storing 10 random values going from 0 to 1. Then the values stored in each of the 1000 random variables are added. This mimics the additive effect of 10 genes with random allele combinations. The result are numbers ranging from 1 to 10, in a population of 1000 individuals; each number is analogous to an allele combination. The resulting histogram, which plots the frequency of each allele combination (or genotype) in the population, is shown on the figure bellow. Each allele configuration will “push for” a particular trait range, making the trait distribution also have the same bell-shaped form.

The bell curve, research studies, and what they mean for you
Studies of the effects of diet and exercise on health variables usually report their results in terms of average responses in a group of participants. Frequently two groups are used, one control and one treatment. For example, in a diet-related study the control group may follow the Standard American Diet, and the treatment group may follow a low carbohydrate diet.
However, you are not the average person; the average person is an abstraction. Research on bell curve distributions tells us that there is about a 68 percentage chance that you will fall within a 1 standard deviation from the average, to the left or the right of the “middle” of the bell curve. Still, even a 0.5 standard deviation above the average is not the average. And, there is approximately a 32 percent chance that you will not be within the larger -1 to 1 standard deviation range. If this is the case, the average results reported may be close to irrelevant for you.
Average results reported in studies are a good starting point for people who are similar to the studies’ participants. But you need to generate your own data, with the goal of “knowing yourself through numbers” by progressively analyzing it. This is akin to building a “numeric diary”. It is not exactly an “N=1” experiment, as some like to say, because you can generate multiple data points (e.g., N=200) on how your body alone responds to diet and lifestyle changes over time.
HealthCorrelator for Excel (HCE)
I think I have finally been able to develop a software tool that can help people do that. I have been using it myself for years, initially as a prototype. You can see the results of my transformation on this post. The challenge for me was to generate a tool that was simple enough to use, and yet powerful enough to give people good insights on what is going on with their body.
The software tool is called HealthCorrelator for Excel (HCE). It runs on Excel, and generates coefficients of association (correlations, which range from -1 to 1) among variables and graphs at the click of a button.
This 5-minute YouTube video shows how the software works in general, and this 10-minute video goes into more detail on how the software can be used to manage a specific health variable. These two videos build on a very small sample dataset, and their focus is on HDL cholesterol management. Nevertheless, the software can be used in the management of just about any health-related variable – e.g., blood glucose, triglycerides, muscle strength, muscle mass, depression episodes etc.
You have to enter data about yourself, and then the software will generate coefficients of association and graphs at the click of a button. As you can see from the videos above, it is very simple. The interpretation of the results is straightforward in most cases, and a bit more complicated in a smaller number of cases. Some results will probably surprise users, and their doctors.
For example, a user who is a patient may be able to show to a doctor that, in the user’s specific case, a diet change influences a particular variable (e.g., triglycerides) much more strongly than a prescription drug or a supplement. More posts will be coming in the future on this blog about these and other related issues.
This means that manipulating environmental factors, such as diet and lifestyle, can strongly influence how the traits are finally expressed in humans. But each individual tends to respond differently to diet and lifestyle changes, because each individual is unique in terms of his or her combination of “nature” and “nurture”. Even identical twins are different in that respect.
When plotted, traits that are influenced by our genes are distributed along a bell-shaped curve. For example, a trait like body fat percentage, when measured in a population of 1000 individuals, will yield a distribution of values that will look like a bell-shaped distribution. This type of distribution is also known in statistics as a “normal” distribution.
Why is that?
The additive effect of genes and the bell curve
The reason is purely mathematical. A measurable trait, like body fat percentage, is usually influenced by several genes. (Sometimes individual genes have a very marked effect, as in genes that “switch on or off” other genes.) Those genes appear at random in a population, and their various combinations spread in response to selection pressures. Selection pressures usually cause a narrowing of the bell-shaped curve distributions of traits in populations.
The genes interact with environmental influences, which also have a certain degree of randomness. The result is a massive combined randomness. It is this massive randomness that leads to the bell-curve distribution. The bell curve itself is not random at all, which is a fascinating aspect of this phenomenon. From “chaos” comes “order”. A bell curve is a well-defined curve that is associated with a function, the probability density function.
The underlying mathematical reason for the bell shape is the central limit theorem. The genes are combined in different individuals as combinations of alleles, where each allele is a variation (or mutation) of a gene. An allele set, for genes in different locations of the human DNA, forms a particular allele combination, called a genotype. The alleles combine their effects, usually in an additive fashion, to influence a trait.
Here is a simple illustration. Let us say one generates 1000 random variables, each storing 10 random values going from 0 to 1. Then the values stored in each of the 1000 random variables are added. This mimics the additive effect of 10 genes with random allele combinations. The result are numbers ranging from 1 to 10, in a population of 1000 individuals; each number is analogous to an allele combination. The resulting histogram, which plots the frequency of each allele combination (or genotype) in the population, is shown on the figure bellow. Each allele configuration will “push for” a particular trait range, making the trait distribution also have the same bell-shaped form.
The bell curve, research studies, and what they mean for you
Studies of the effects of diet and exercise on health variables usually report their results in terms of average responses in a group of participants. Frequently two groups are used, one control and one treatment. For example, in a diet-related study the control group may follow the Standard American Diet, and the treatment group may follow a low carbohydrate diet.
However, you are not the average person; the average person is an abstraction. Research on bell curve distributions tells us that there is about a 68 percentage chance that you will fall within a 1 standard deviation from the average, to the left or the right of the “middle” of the bell curve. Still, even a 0.5 standard deviation above the average is not the average. And, there is approximately a 32 percent chance that you will not be within the larger -1 to 1 standard deviation range. If this is the case, the average results reported may be close to irrelevant for you.
Average results reported in studies are a good starting point for people who are similar to the studies’ participants. But you need to generate your own data, with the goal of “knowing yourself through numbers” by progressively analyzing it. This is akin to building a “numeric diary”. It is not exactly an “N=1” experiment, as some like to say, because you can generate multiple data points (e.g., N=200) on how your body alone responds to diet and lifestyle changes over time.
HealthCorrelator for Excel (HCE)
I think I have finally been able to develop a software tool that can help people do that. I have been using it myself for years, initially as a prototype. You can see the results of my transformation on this post. The challenge for me was to generate a tool that was simple enough to use, and yet powerful enough to give people good insights on what is going on with their body.
The software tool is called HealthCorrelator for Excel (HCE). It runs on Excel, and generates coefficients of association (correlations, which range from -1 to 1) among variables and graphs at the click of a button.
This 5-minute YouTube video shows how the software works in general, and this 10-minute video goes into more detail on how the software can be used to manage a specific health variable. These two videos build on a very small sample dataset, and their focus is on HDL cholesterol management. Nevertheless, the software can be used in the management of just about any health-related variable – e.g., blood glucose, triglycerides, muscle strength, muscle mass, depression episodes etc.
You have to enter data about yourself, and then the software will generate coefficients of association and graphs at the click of a button. As you can see from the videos above, it is very simple. The interpretation of the results is straightforward in most cases, and a bit more complicated in a smaller number of cases. Some results will probably surprise users, and their doctors.
For example, a user who is a patient may be able to show to a doctor that, in the user’s specific case, a diet change influences a particular variable (e.g., triglycerides) much more strongly than a prescription drug or a supplement. More posts will be coming in the future on this blog about these and other related issues.
Sponsored by:
Saturday, 20 November 2010
Glucose Tolerance in Non-industrial Cultures
Background
Glucose is the predominant blood sugar and one of the body's two main fuel sources (the other is fatty acids). Glucose, in one form or another, is also the main form of digestible dietary carbohydrate in nearly all human diets. Starch is made of long chains of glucose molecules, which are rapidly liberated and absorbed during digestion. Sucrose, or table sugar, is made of one glucose and one fructose molecule, which are separated before absorption.
Blood glucose is essential for life, but it can also be damaging if there is too much of it. Therefore, the body tries to keep it within a relatively tight range. Normal fasting glucose is roughly between 70 and 90 mg/dL*, but in the same individual it's usually within about 5 mg/dL on any given day. Sustained glucose above 160 mg/dL or so causes damage to multiple organ systems. Some people would put that number closer to 140 mg/dL.
The amount of glucose contained in a potato far exceeds the amount contained in the blood, so if all that glucose were to enter the blood at once, it would lead to a highly damaging blood glucose level. Fortunately, the body has a hormone designed to keep this from happening: insulin. Insulin tells cells to internalize glucose from the blood, and suppresses glucose release by the liver. It's released by the pancreas in response to eating carbohydrate, and protein to a lesser extent. The amount of insulin released is proportional to the amount of carbohydrate ingested, so that glucose entering the blood is cleared before it can accumulate.
Insulin doesn't clear all the glucose as it enters the bloodstream, however. Some of it does accumulate, leading to a spike in blood glucose. This usually doesn't exceed 130 mg/dL in a truly healthy person, and even if it approaches that level it's only briefly. However, diabetics have reduced insulin signaling, and eating a typical meal can cause their glucose to exceed 300 mg/dL due to reduced insulin action and/or insulin secretion. In affluent nations, this is typically due to type II diabetes, which begins as insulin resistance, a condition in which insulin is actually higher than normal but cells fail to respond to it. The next step is the failure of insulin-secreting beta cells, which is what generally precipitates actual diabetes.
The precursor to diabetes is called glucose intolerance, or pre-diabetes. In someone with glucose intolerance, blood glucose after a typical meal will exceed that of a healthy person, but will not reach the diabetic range (a common definition of diabetes is 200 mg/dL or higher, 2 hours after ingesting 75g of glucose). Glucose tolerance refers to a person's ability to control blood glucose when challenged with dietary glucose, and can be used in some contexts as a useful predictor of diabetes risk and general metabolic health. Doctors use the oral glucose tolerance test (OGTT), which involves drinking 60-100g glucose and measuring blood glucose after one or two hours, to determine glucose tolerance.
Why do we care about glucose tolerance in non-industrial cultures?
One of the problems with modern medical research is that so many people in our culture are metabolically sick that it can be difficult to know if what we consider "normal" is really normal or healthy in the broader sense. Non-industrial cultures allow us to examine what the human metabolism is like in the absence of metabolic disease. I admit this rests on certain assumptions, particularly that these people aren't sick themselves. I don't think all non-industrial cultures are necessarily healthy, but I'm going to stick with those that research has shown have an exceptionally low prevalence of diabetes (by Western standards) and other "diseases of civilization" for the purposes of this post.
Here's the question I really want to answer in this post: do healthy non-industrial cultures with a very high carbohydrate intake have an excellent glucose tolerance, such that their blood glucose doesn't rise to a high level, or are they simply resistant to the damaging effects of high blood glucose?
The data
I'm going to start with an extreme example. In the 1960s, when it was fashionable to study non-industrial cultures, researchers investigated the diet and health of a culture in Tukisenta, in the highlands of Papua New Guinea. The eat practically nothing but sweet potatoes, and their typical daily fare is 94.6 percent carbohydrate. Whether or not you believe that exact number, their diet was clearly extraordinarily high in carbohydrate. They administered 100g OGTTs and measured blood glucose at one hour, which is a very stringent OGTT. They compared the results to those obtained in the 1965 Tecumseh study (US) obtained by the same method. Here's what they found (1):
 Compared to Americans, in Tukisenta they had an extraordinary glucose tolerance at all ages. At one hour, their blood glucose was scarcely above normal fasting values, and glucose tolerance only decreased modestly with age. In contrast, in Americans over 50 years old, the average one-hour value was around 180 mg/dL!
Now let's take a look at the African Bantu in the Lobaye region of the Central African Republic. The Bantu are a large ethnic group who primarily subsist on a diverse array of starchy foods including grains, beans, plantains and root crops. One hour after a 100g OGTT, their blood glucose was 113 mg/dL, compared to 139 mg/dL in American controls (2). Those numbers are comparable to what investigators found in Tukisenta, and indicate an excellent glucose tolerance in the Bantu.
In South America, different investigators studied a group of native Americans in central Brazil that subsist primarily on cassava (a starchy root crop) and freshwater fish. Average blood glucose one hour after a 100g OGTT was 94 mg/dl, and only 2 out of 106 people tested had a reading over 160 mg/dL (both were older women) (Western Diseases: Their Emergence and Prevention, p. 149). Again, that indicates a phenomenal glucose tolerance by Western standards.
I have to conclude that high-carbohydrate non-industrial cultures probably don't experience damaging high blood glucose levels, because their glucose tolerance is up to the task of shuttling a huge amount of glucose out of the bloodstream before that happens.
Not so fast...
Now let's turn our attention to another study that may throw a wrench in the gears. A while back, I found a paper containing OGTT data for the !Kung San (also called the Bushmen), a hunter-gatherer group living in the Kalahari desert of Africa. I reported in an earlier post that they had a good glucose tolerance. When I revisited the paper recently, I realized I had misread it and in fact, their glucose tolerance was actually pretty poor.
Investigators administered a 50g OGTT, half what the other studies used. At one hour, the San had blood glucose readings of 169 mg/dL, compared to 142 mg/dL in Caucasian controls (3)! I suspect a 100g OGTT would have put them close to the diabetic range.
Wait a minute, these guys are hunter-gatherers living the ancestral lifestyle; aren't they supposed to be super healthy?? First of all, like many hunter-gatherer groups the San are very small people: the men in this study were only 46 kg (101 lbs). The smaller you are, the more a given amount of carbohydrate will raise your blood glucose. Also, while I was mulling this over, I recalled a discussion where non-diabetic people were discussing their 'diabetic' OGTT values while on a low-carbohydrate diet. Apparently, carbohydrate refeeding for a few days generally reverses this and allows a normal OGTT in most people. It turns out this effect has been known for the better part of a century.
So what were the San eating? The study was conducted in October of 1970. The San diet changes seasonally, however their main staple food is the mongongo nut, which is mostly fat and which is available year-round (according to The !Kung San: Men, Women and Work in a Foraging Society). Their carbohydrate intake is generally low by Western standards, and at times of the year it is very low. This varies by the availability of other foods, but they generally don't seem to relish the fibrous starchy root crops that are available in the area, as they mostly eat them when other food is scarce. Jean-Louis Tu has posted a nice analysis of the San diet on BeyondVeg (4). Here's a photo of a San man collecting mongongo nuts from The !Kung San: Men, Women and Work in a Foraging Society:
 What did the authors of the OGTT study have to say about their diet? Acknowledging that prior carbohydrate intake may have played a role in the OGTT results of the San, they made the following remark:
You can draw your own conclusions, but I think the high OGTT result of the San probably reflect a low habitual carbohydrate intake, and not pre-diabetes. I have a very hard time believing that this culture wasn't able to handle the moderate amount of carbohydrate in their diet effectively, as observers have never described diabetic complications among them.
Putting it all together
This brings me to my hypothesis. I think a healthy human body is extraordinarily flexible in its ability to adapt to a very broad range of carbohydrate intakes, and adjusts glucose tolerance accordingly to maintain carbohydrate handling in a healthy range. In the context of a healthy diet and lifestyle (from birth), I suspect that nearly anyone can adjust to a very high carbohydrate intake without getting dangerous blood glucose spikes. A low carbohydrate intake leads to impaired glucose handling and better fat handling, as one would expect. This can show up as impaired glucose tolerance or even 'diabetes' on an OGTT, but that does not necessarily reflect a pathological state in my opinion.
Every person is different based on lifestyle, diet, personal history and genetics. Not everyone in affluent nations has a good glucose tolerance, and some people will never be able to handle starch effectively under any circumstances. The best way to know how your body reacts to carbohydrate is to test your own post-meal blood glucose using a glucose meter. They are inexpensive and work well. For the most informative result, eat a relatively consistent amount of carbohydrate for a week to allow your body to adapt, then take a glucose measurement 1 and 2 hours after a meal. If you don't eat much carbohydrate, eating a potato might make you think you're diabetic, whereas after a week of adaptation you may find that a large potato does not spike your blood glucose beyond the healthy range.
Exercise is a powerful tool for combating glucose intolerance, as it increases the muscles' demand for glucose, causing them to transport it out of the blood greedily after a meal. Any exercise that depletes muscle glycogen should be effective.
* Assuming a typical carbohydrate intake. Chris Kresser recently argued, based on several studies, that true normal fasting glucose for a person eating a typical amount of carbohydrate is below 83 mg/dL. Low-carbohydrate eating may raise this number, but that doesn't necessarily indicate a pathological change. High-carbohydrate cultures such as the Kitavans, Aymara and New Guineans tend to have fasting values in the low 60s to low 70s. I suspect that a very high carbohydrate intake generally lowers fasting glucose in healthy people. That seems to be the case so far for Chris Voigt, on his diet of 20 potatoes a day. Stay tuned for an interview with Mr. Voigt in early December.
Glucose is the predominant blood sugar and one of the body's two main fuel sources (the other is fatty acids). Glucose, in one form or another, is also the main form of digestible dietary carbohydrate in nearly all human diets. Starch is made of long chains of glucose molecules, which are rapidly liberated and absorbed during digestion. Sucrose, or table sugar, is made of one glucose and one fructose molecule, which are separated before absorption.
Blood glucose is essential for life, but it can also be damaging if there is too much of it. Therefore, the body tries to keep it within a relatively tight range. Normal fasting glucose is roughly between 70 and 90 mg/dL*, but in the same individual it's usually within about 5 mg/dL on any given day. Sustained glucose above 160 mg/dL or so causes damage to multiple organ systems. Some people would put that number closer to 140 mg/dL.
The amount of glucose contained in a potato far exceeds the amount contained in the blood, so if all that glucose were to enter the blood at once, it would lead to a highly damaging blood glucose level. Fortunately, the body has a hormone designed to keep this from happening: insulin. Insulin tells cells to internalize glucose from the blood, and suppresses glucose release by the liver. It's released by the pancreas in response to eating carbohydrate, and protein to a lesser extent. The amount of insulin released is proportional to the amount of carbohydrate ingested, so that glucose entering the blood is cleared before it can accumulate.
Insulin doesn't clear all the glucose as it enters the bloodstream, however. Some of it does accumulate, leading to a spike in blood glucose. This usually doesn't exceed 130 mg/dL in a truly healthy person, and even if it approaches that level it's only briefly. However, diabetics have reduced insulin signaling, and eating a typical meal can cause their glucose to exceed 300 mg/dL due to reduced insulin action and/or insulin secretion. In affluent nations, this is typically due to type II diabetes, which begins as insulin resistance, a condition in which insulin is actually higher than normal but cells fail to respond to it. The next step is the failure of insulin-secreting beta cells, which is what generally precipitates actual diabetes.
The precursor to diabetes is called glucose intolerance, or pre-diabetes. In someone with glucose intolerance, blood glucose after a typical meal will exceed that of a healthy person, but will not reach the diabetic range (a common definition of diabetes is 200 mg/dL or higher, 2 hours after ingesting 75g of glucose). Glucose tolerance refers to a person's ability to control blood glucose when challenged with dietary glucose, and can be used in some contexts as a useful predictor of diabetes risk and general metabolic health. Doctors use the oral glucose tolerance test (OGTT), which involves drinking 60-100g glucose and measuring blood glucose after one or two hours, to determine glucose tolerance.
Why do we care about glucose tolerance in non-industrial cultures?
One of the problems with modern medical research is that so many people in our culture are metabolically sick that it can be difficult to know if what we consider "normal" is really normal or healthy in the broader sense. Non-industrial cultures allow us to examine what the human metabolism is like in the absence of metabolic disease. I admit this rests on certain assumptions, particularly that these people aren't sick themselves. I don't think all non-industrial cultures are necessarily healthy, but I'm going to stick with those that research has shown have an exceptionally low prevalence of diabetes (by Western standards) and other "diseases of civilization" for the purposes of this post.
Here's the question I really want to answer in this post: do healthy non-industrial cultures with a very high carbohydrate intake have an excellent glucose tolerance, such that their blood glucose doesn't rise to a high level, or are they simply resistant to the damaging effects of high blood glucose?
The data
I'm going to start with an extreme example. In the 1960s, when it was fashionable to study non-industrial cultures, researchers investigated the diet and health of a culture in Tukisenta, in the highlands of Papua New Guinea. The eat practically nothing but sweet potatoes, and their typical daily fare is 94.6 percent carbohydrate. Whether or not you believe that exact number, their diet was clearly extraordinarily high in carbohydrate. They administered 100g OGTTs and measured blood glucose at one hour, which is a very stringent OGTT. They compared the results to those obtained in the 1965 Tecumseh study (US) obtained by the same method. Here's what they found (1):
 Compared to Americans, in Tukisenta they had an extraordinary glucose tolerance at all ages. At one hour, their blood glucose was scarcely above normal fasting values, and glucose tolerance only decreased modestly with age. In contrast, in Americans over 50 years old, the average one-hour value was around 180 mg/dL!
Now let's take a look at the African Bantu in the Lobaye region of the Central African Republic. The Bantu are a large ethnic group who primarily subsist on a diverse array of starchy foods including grains, beans, plantains and root crops. One hour after a 100g OGTT, their blood glucose was 113 mg/dL, compared to 139 mg/dL in American controls (2). Those numbers are comparable to what investigators found in Tukisenta, and indicate an excellent glucose tolerance in the Bantu.
In South America, different investigators studied a group of native Americans in central Brazil that subsist primarily on cassava (a starchy root crop) and freshwater fish. Average blood glucose one hour after a 100g OGTT was 94 mg/dl, and only 2 out of 106 people tested had a reading over 160 mg/dL (both were older women) (Western Diseases: Their Emergence and Prevention, p. 149). Again, that indicates a phenomenal glucose tolerance by Western standards.
I have to conclude that high-carbohydrate non-industrial cultures probably don't experience damaging high blood glucose levels, because their glucose tolerance is up to the task of shuttling a huge amount of glucose out of the bloodstream before that happens.
Not so fast...
Now let's turn our attention to another study that may throw a wrench in the gears. A while back, I found a paper containing OGTT data for the !Kung San (also called the Bushmen), a hunter-gatherer group living in the Kalahari desert of Africa. I reported in an earlier post that they had a good glucose tolerance. When I revisited the paper recently, I realized I had misread it and in fact, their glucose tolerance was actually pretty poor.
Investigators administered a 50g OGTT, half what the other studies used. At one hour, the San had blood glucose readings of 169 mg/dL, compared to 142 mg/dL in Caucasian controls (3)! I suspect a 100g OGTT would have put them close to the diabetic range.
Wait a minute, these guys are hunter-gatherers living the ancestral lifestyle; aren't they supposed to be super healthy?? First of all, like many hunter-gatherer groups the San are very small people: the men in this study were only 46 kg (101 lbs). The smaller you are, the more a given amount of carbohydrate will raise your blood glucose. Also, while I was mulling this over, I recalled a discussion where non-diabetic people were discussing their 'diabetic' OGTT values while on a low-carbohydrate diet. Apparently, carbohydrate refeeding for a few days generally reverses this and allows a normal OGTT in most people. It turns out this effect has been known for the better part of a century.
So what were the San eating? The study was conducted in October of 1970. The San diet changes seasonally, however their main staple food is the mongongo nut, which is mostly fat and which is available year-round (according to The !Kung San: Men, Women and Work in a Foraging Society). Their carbohydrate intake is generally low by Western standards, and at times of the year it is very low. This varies by the availability of other foods, but they generally don't seem to relish the fibrous starchy root crops that are available in the area, as they mostly eat them when other food is scarce. Jean-Louis Tu has posted a nice analysis of the San diet on BeyondVeg (4). Here's a photo of a San man collecting mongongo nuts from The !Kung San: Men, Women and Work in a Foraging Society:
 What did the authors of the OGTT study have to say about their diet? Acknowledging that prior carbohydrate intake may have played a role in the OGTT results of the San, they made the following remark:
a retrospective dietary history (M. J. Konner, personal communication, 1971) indicated that the [San], in fact, consumed fairly large amounts of carbohydrate-rich vegetable food during the week before testing.However, the dietary history was not provided, nor has it been published, so we have no way to assess the statement's accuracy or what was meant by "fairly large amounts of carbohydrate-rich vegetable food." Given the fact that the San diet typically ranges from moderately low to very low in carbohydrate, I suspect they were not getting much carbohydrate as a percentage of calories. Looking at the nutritional value of the starchy root foods they typically eat in appendix D of The !Kung San: Men, Women and Work in a Foraging Society, they are fibrous and most contain a low concentration of starch compared to a potato for example. The investigators may have been misled by the volume of these foods eaten, not realizing that they are not as rich in carbohydrate as the starchy root crops they are more familiar with.
You can draw your own conclusions, but I think the high OGTT result of the San probably reflect a low habitual carbohydrate intake, and not pre-diabetes. I have a very hard time believing that this culture wasn't able to handle the moderate amount of carbohydrate in their diet effectively, as observers have never described diabetic complications among them.
Putting it all together
This brings me to my hypothesis. I think a healthy human body is extraordinarily flexible in its ability to adapt to a very broad range of carbohydrate intakes, and adjusts glucose tolerance accordingly to maintain carbohydrate handling in a healthy range. In the context of a healthy diet and lifestyle (from birth), I suspect that nearly anyone can adjust to a very high carbohydrate intake without getting dangerous blood glucose spikes. A low carbohydrate intake leads to impaired glucose handling and better fat handling, as one would expect. This can show up as impaired glucose tolerance or even 'diabetes' on an OGTT, but that does not necessarily reflect a pathological state in my opinion.
Every person is different based on lifestyle, diet, personal history and genetics. Not everyone in affluent nations has a good glucose tolerance, and some people will never be able to handle starch effectively under any circumstances. The best way to know how your body reacts to carbohydrate is to test your own post-meal blood glucose using a glucose meter. They are inexpensive and work well. For the most informative result, eat a relatively consistent amount of carbohydrate for a week to allow your body to adapt, then take a glucose measurement 1 and 2 hours after a meal. If you don't eat much carbohydrate, eating a potato might make you think you're diabetic, whereas after a week of adaptation you may find that a large potato does not spike your blood glucose beyond the healthy range.
Exercise is a powerful tool for combating glucose intolerance, as it increases the muscles' demand for glucose, causing them to transport it out of the blood greedily after a meal. Any exercise that depletes muscle glycogen should be effective.
* Assuming a typical carbohydrate intake. Chris Kresser recently argued, based on several studies, that true normal fasting glucose for a person eating a typical amount of carbohydrate is below 83 mg/dL. Low-carbohydrate eating may raise this number, but that doesn't necessarily indicate a pathological change. High-carbohydrate cultures such as the Kitavans, Aymara and New Guineans tend to have fasting values in the low 60s to low 70s. I suspect that a very high carbohydrate intake generally lowers fasting glucose in healthy people. That seems to be the case so far for Chris Voigt, on his diet of 20 potatoes a day. Stay tuned for an interview with Mr. Voigt in early December.
Sponsored by:
Subscribe to:
Posts (Atom)