Gary Taubes gave a lecture at UW last Thursday. Thanks to all the Whole Health Source readers who showed up. Gary's talk was titled "Why We Get Fat: Adiposity 101 and the Alternative Hypothesis of Obesity". He was hosted by Dr. Philippe Hujoel, the UW epidemiologist and dentist who authored the paper "Dietary Carbohydrates and Dental-Systemic Diseases" (1).
Gary's first target was the commonly held idea that obesity is simply caused by eating too much and exercising too little, and thus the cure is to eat less and exercise more. He used numerous examples from both humans and animals to show that fat mass is biologically regulated, rather than being the passive result of voluntary behaviors such as eating and exercise. He presented evidence of cultures remaining lean despite a huge and continuous surplus of food, as long as they stayed on their traditional diet. He also described how they subsequently became obese and diabetic on industrial foods (the Pima, for example).
He then moved into what he feels is the biological cause of obesity: excessive insulin keeping fat from exiting fat cells. It's true that insulin is a storage hormone, at the cellular level. However, fat mass regulation involves a dynamic interplay between many different interlacing systems that determine both overall energy intake and expenditure, as well as local availability of nutrients at the tissue level (i.e., how much fat gets into your fat tissue vs. your muscle tissue). I think the cause of obesity is likely to be more complex than insulin signaling.
He also offered the "carbohydrate hypothesis", which is the idea that carbohydrate, or at least refined carbohydrate, is behind the obesity epidemic and perhaps other metabolic problems. This is due to its ability to elevate insulin. I agree that refined carbohydrate, particularly white flour and sugar, is probably a central part of the problem. I'm also open to the possibility that some people in industrial nations are genuinely sensitive to carbohydrate regardless of what form it's in, although that remains to be rigorously tested. I don't think carbohydrate is sufficient to cause obesity per se, due to the many lean and healthy cultures that eat high carbohydrate diets*. Gary acknowledges this, and thinks there's probably another factor that's involved in allowing carbohydrate sensitivity to develop, for example excessive sugar.
I had the opportunity to speak with Gary at length on Thursday, as well as on Friday at dinner. Gary is a very nice guy-- a straightforward New York personality who's not averse to a friendly disagreement. In case any of you are wondering, he looks good. Good body composition, nice skin, hair and teeth (apologies to Gary for the analysis). Philippe and his wife took us out to a very nice restaurant, where we had a leisurely four-hour meal, and Dr. Mike Eades was in town so he joined us as well. Mike has a strong Southern accent and is also a pleasant guy. Philippe and his wife are generous and engaging people. It was a great evening. The restaurant was nice enough that I wasn't going to be picky about the food-- I ate everything that was put in front of me and enjoyed it.
* I'm talking about prevention rather than cure here. I acknowledge that many people have had some success losing fat using low-carbohydrate diets, including two gentlemen I met on Thursday.
Sunday, 18 April 2010


Ketones and Ketosis: Physiological and pathological forms
Ketones are compounds that have a specific chemical structure. The figure below (from: Wikipedia) shows the chemical structure of various types of ketones. As you can see, all ketones share a carbonyl group; that is the “O=” part of their chemical structure. A carbonyl group is an oxygen atom double-bonded to a carbon atom.

Technically speaking, many substances can be classified as ketones. Not all of these are involved in the same metabolic processes in humans. For example, fructose is technically a ketone, but it is not one of the three main ketones produced by humans from dietary macronutrients (discussed below), and is not metabolized in the same way as are those three main ketones.
Humans, as well as most other vertebrates, produce three main ketones (also known as ketone bodies) from dietary macronutrients. These are acetone, acetoacetate and beta-hydroxybutyrate. Low carbohydrate diets tend to promote glycogen depletion, which in turn leads to increased production of these ketones. Glycogen is stored in the liver and muscles. Liver glycogen is used by the body to maintain blood glucose levels within a narrow range in the fasted state. Examples of diets that tend to promote glycogen depletion are the Atkins Diet and Kwaśniewski’s Optimal Diet.
A search for articles on ketosis in scientific databases usually returns a large number of articles dealing with ketosis in cows. Why? The reason is that ketosis reduces milk production, by both reducing the amount of fat and glucose available for milk synthesis. In fact, ketosis is referred to as a “disease” in cows.
In humans, most articles on ketosis refer to pathological ketosis (a.k.a. ketoacidosis), especially in the context of uncontrolled diabetes. One notable exception is an article by Williamson (2005), from which the table below was taken. The table shows ketone concentrations in the blood under various circumstances, in mmol/l.
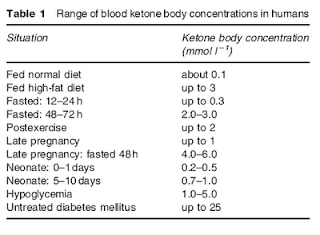
As you can see, relatively high concentrations of ketones occur in newborn babies (neonate), in adults post-exercise, and in adults fed a high fat diet. Generally speaking, a high fat diet is a low carbohydrate diet, and a high carbohydrate diet is a low fat diet. (One occasionally sees diets that are high in both carbohydrates and fat; which seem excellent at increasing body fat and thus reducing life span. This diet is apparently popular among sumo wrestlers, where genetics and vigorous exercise usually counter the negative diet effects.)
Situations in which ketosis occurs in newborn babies (neonate), in adults post-exercise, and in adults fed a high fat diet are all examples of physiological, or benign, ketosis. Ketones are also found in low concentrations in adults fed a standard American diet.
Ketones are found in very high concentrations in adults with untreated diabetes. This is an example of pathological ketosis, even though ketones are produced as part of a protective compensatory mechanism to spare glucose for the brain and red blood cells (which need glucose to function properly). Pathological ketosis leads to serum ketone levels that can be as much as 80 times (or more) those found in physiological ketosis.
Serum ketone concentrations increase proportionally to decreases in stored glycogen and, when glycogen is low or absent, correlate strongly (and inversely) with blood glucose levels. In some individuals glycogen is practically absent due to a genetic condition that leads to hepatic glycogen synthase deficiency. This is a deficiency of the enzyme that promotes glycogen synthesis by the liver. The figure below (also from Williamson, 2005) shows the variations in glucose and ketone levels in a child with glycogen synthase deficiency.

What happened with this child? Williamson answers this question: “It is of interest that this particular child suffered no ill effects from the daily exposure to high concentrations of ketone bodies, underlining their role as normal substrates for the brain when available.”
Unlike glucose and lipoprotein-bound fats (in VLDL, for example), unused ketones cannot be converted back to substances that can be stored by the body. Thus excess ketones are eliminated in the urine; leading to their detection by various tests, e.g., Ketostix tests. This elimination of unused ketones in the urine is one of the reasons why low carbohydrate diets are believed to lead to enhanced body fat loss.
In summary, ketones are present in the blood most of the time, in most people, whether they are on a ketogenic diet or not. If they do not show up in the urine, it does not mean that they are not present in the blood; although it usually means that their concentration in the blood is not that high. Like glucose, ketones are soluble in water, and thus circulate in the blood without the need for carriers (e.g., albumin, which is needed for the transport of free fatty acids; and VLDL, needed for the transport of triglycerides). Like glucose, they are used as sources of energy by the brain and by muscle tissues.
It has been speculated that ketosis leads to accelerated aging, through the formation of advanced glycation endproducts (AGEs), a speculation that seems to be largely unfounded (see this post). It is difficult to believe that a metabolic process that is universally found in babies and adults post-exercise would have been favored by evolution if it led to accelerated aging.
References:
Williamson, D.H. (2005). Ketosis. Encyclopedia of Human Nutrition, 91-98.

Technically speaking, many substances can be classified as ketones. Not all of these are involved in the same metabolic processes in humans. For example, fructose is technically a ketone, but it is not one of the three main ketones produced by humans from dietary macronutrients (discussed below), and is not metabolized in the same way as are those three main ketones.
Humans, as well as most other vertebrates, produce three main ketones (also known as ketone bodies) from dietary macronutrients. These are acetone, acetoacetate and beta-hydroxybutyrate. Low carbohydrate diets tend to promote glycogen depletion, which in turn leads to increased production of these ketones. Glycogen is stored in the liver and muscles. Liver glycogen is used by the body to maintain blood glucose levels within a narrow range in the fasted state. Examples of diets that tend to promote glycogen depletion are the Atkins Diet and Kwaśniewski’s Optimal Diet.
A search for articles on ketosis in scientific databases usually returns a large number of articles dealing with ketosis in cows. Why? The reason is that ketosis reduces milk production, by both reducing the amount of fat and glucose available for milk synthesis. In fact, ketosis is referred to as a “disease” in cows.
In humans, most articles on ketosis refer to pathological ketosis (a.k.a. ketoacidosis), especially in the context of uncontrolled diabetes. One notable exception is an article by Williamson (2005), from which the table below was taken. The table shows ketone concentrations in the blood under various circumstances, in mmol/l.

As you can see, relatively high concentrations of ketones occur in newborn babies (neonate), in adults post-exercise, and in adults fed a high fat diet. Generally speaking, a high fat diet is a low carbohydrate diet, and a high carbohydrate diet is a low fat diet. (One occasionally sees diets that are high in both carbohydrates and fat; which seem excellent at increasing body fat and thus reducing life span. This diet is apparently popular among sumo wrestlers, where genetics and vigorous exercise usually counter the negative diet effects.)
Situations in which ketosis occurs in newborn babies (neonate), in adults post-exercise, and in adults fed a high fat diet are all examples of physiological, or benign, ketosis. Ketones are also found in low concentrations in adults fed a standard American diet.
Ketones are found in very high concentrations in adults with untreated diabetes. This is an example of pathological ketosis, even though ketones are produced as part of a protective compensatory mechanism to spare glucose for the brain and red blood cells (which need glucose to function properly). Pathological ketosis leads to serum ketone levels that can be as much as 80 times (or more) those found in physiological ketosis.
Serum ketone concentrations increase proportionally to decreases in stored glycogen and, when glycogen is low or absent, correlate strongly (and inversely) with blood glucose levels. In some individuals glycogen is practically absent due to a genetic condition that leads to hepatic glycogen synthase deficiency. This is a deficiency of the enzyme that promotes glycogen synthesis by the liver. The figure below (also from Williamson, 2005) shows the variations in glucose and ketone levels in a child with glycogen synthase deficiency.

What happened with this child? Williamson answers this question: “It is of interest that this particular child suffered no ill effects from the daily exposure to high concentrations of ketone bodies, underlining their role as normal substrates for the brain when available.”
Unlike glucose and lipoprotein-bound fats (in VLDL, for example), unused ketones cannot be converted back to substances that can be stored by the body. Thus excess ketones are eliminated in the urine; leading to their detection by various tests, e.g., Ketostix tests. This elimination of unused ketones in the urine is one of the reasons why low carbohydrate diets are believed to lead to enhanced body fat loss.
In summary, ketones are present in the blood most of the time, in most people, whether they are on a ketogenic diet or not. If they do not show up in the urine, it does not mean that they are not present in the blood; although it usually means that their concentration in the blood is not that high. Like glucose, ketones are soluble in water, and thus circulate in the blood without the need for carriers (e.g., albumin, which is needed for the transport of free fatty acids; and VLDL, needed for the transport of triglycerides). Like glucose, they are used as sources of energy by the brain and by muscle tissues.
It has been speculated that ketosis leads to accelerated aging, through the formation of advanced glycation endproducts (AGEs), a speculation that seems to be largely unfounded (see this post). It is difficult to believe that a metabolic process that is universally found in babies and adults post-exercise would have been favored by evolution if it led to accelerated aging.
References:
Williamson, D.H. (2005). Ketosis. Encyclopedia of Human Nutrition, 91-98.
Sponsored by:
Thursday, 15 April 2010
Copper in Food
Sources of Copper
It isn't hard to get enough copper-- unless you eat an industrial diet. I've compiled a chart showing the copper content of various refined and unrefined foods to illustrate the point. The left side shows industrial staple foods, while the right side shows whole foods. I've incorporated a few that would have been typical of Polynesian and Melanesian cultures apparently free of cardiovascular disease. The serving sizes are what one might reasonably eat at a meal: roughly 200 calories for grains, tubers and whole coconut; 1/4 pound for animal products; 1/2 teaspoon for salt; 1 cup for raw kale; 1 oz for sugar.
 Note that beef liver is off the chart at 488 percent of the USDA recommended daily allowance. I don't know if you'd want to sit down and eat a quarter pound of beef liver, but you get the picture. Beef liver is nature's multivitamin: hands down the Most Nutritious Food in the World. That's because it acts as a storage depot for a number of important micronutrients, as well as being a biochemical factory that requires a large amount of B vitamins to function. You can see that muscle tissue isn't a great source of copper compared to other organs.
Beef liver is so full of micronutrients, it shouldn't be eaten every day. Think of it in terms of the composition of a cow's body. The edible carcass is mostly muscle, but a significant portion is liver. I think it makes sense to eat some form of liver about once per week.
Modern Agriculture Produces Micronutrient-poor Foods
The numbers in the graph above come from NutritionData, my main source of food nutrient composition. The problem with relying on this kind of information is it ignores the variability in micronutrient content due to plant strain, soil quality, et cetera.
The unfortunate fact is that micronutrient levels have declined substantially over the course of the 20th century, even in whole foods. Dr. Donald R. Davis has documented the substantial decline in copper and other micronutrients in American foods over the second half of the last century (1). An even more marked decrease has occurred in the UK (2), with similar trends worldwide. On average, the copper content of vegetables in the UK has declined 76 percent since 1940. Most of the decrease has taken place since 1978. Fruits are down 20 percent and meats are down 24 percent.
I find this extremely disturbing, as it will affect even people eating whole food diets. This is yet another reason to buy from artisanal producers, who are likely to use more traditional plant varieties and grow in richer soil. Grass-fed beef should be just as nutritious as it has always been. Some people may also wish to grow, hunt or fish their own food.
Sponsored by:
Insulin responses to foods rich in carbohydrates and protein
Insulin is often presented as a hormone that is at the core of the diseases of civilization, particularly because of the insulin response elicited by foods rich in refined carbohydrates and sugars. What is often not mentioned is that protein also elicits an insulin response and so do foods where carbohydrates are mixed with fat. Sometimes the insulin responses are way more than one would expect based on the macronutrient compositions of the foods.
Holt et al. (1997; full reference at the end of this post) conducted a classic study of insulin responses. This study has been widely cited, and paints an interesting picture of differences in insulin responses to various foods. But you have to be careful where you look. There has been some confusion about the results because of the way they are often reported in places like Wikipedia and on various Internet sites that refer to the study.
The key thing to bear in mind when reviewing this study is that the amounts of food used were designed to have the same calorie content: 1000 kJ or 240 kcal (i.e., 240 calories). This led to wild variations in the size of the portions that are compared and their weight in grams. Also, some of the food portions are probably not what people usually eat in one sitting.
In Holt et al.’s (1997) study the participants were 41 lean and healthy university students. They were fed 1000 kJ (240 kcal) portions of the test foods on separate mornings after a 10-hour fast overnight. Blood insulin levels were measured at different times within a 120-minute period after each meal. An insulin score was then calculated from the area under the insulin response curve for each food; white bread was used as the reference food.
Part of Table 2 on page 1267 is shown below (the full text version of the paper is linked at the end of this post), just to illustrate the types and amounts of food served, and the macronutrient breakdown for each food. I hope you can see what I meant when I said that some of the food portions are probably not what people usually eat in one sitting. I don’t think it would be hard to find someone who would eat 158 g of beef steak in one sitting, but 333 g of fish is a little more difficult. Fish has a higher proportion of protein than beef steak, and thus is more satiating. The same goes for 625 g of orange, about 6 oranges. Foods that have more fat have more calories per gram; hence the smaller portions served for high-fat foods.

Table 4 of the article is a bit long, so I am providing it in two parts below. AUC stands for “area under the curve”. As you can see, for isocaloric portions of different foods (i.e., with the same amount of calories), there is a huge variation in insulin response. The insulin AUCs are shown on the second numeric column from the left. Also note that the insulin responses (AUC) for white bread varied in different meals. This complicates things a bit, but at least provides a more realistic view of the responses since each participant served as his or her own control.

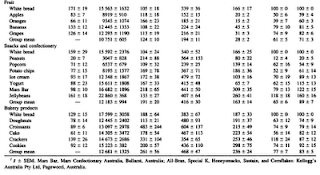
Look at the third column from the right, which shows the insulin responses per gram of each food, compared with the response to white bread, always shown at the top for each group of related foods (e.g., protein-rich foods). The gram-adjusted response for whole-meal bread is rather high, and so is the glucose response. The gram-adjusted insulin response to potatoes is less than one-third of the response to white bread, even though the non-gram-adjusted glucose response is higher. The insulin response to beef is also less than one-third of the response to white bread, gram-for-gram. Even cheese leads to a gram-adjusted response that is about half the one for white bread, and I don’t think many people will eat the same amount of cheese in one sitting as they would do with white bread.
In summary, insulin responses to protein-rich foods are often 50 to 70 percent lower than responses to equivalent amounts of refined carbohydrate-rich foods. Also, insulin responses to unrefined carbohydrate-rich foods (e.g., potato, fruits) are often 70 to 90 percent lower than responses to equivalent amounts of refined carbohydrate-rich foods.
Why do insulin levels go up in response to dietary protein?
One of the reasons is that insulin is needed for tissue protein synthesis. That is, increased circulating protein (as amino acids) and insulin have a net anabolic effect, promoting muscle growth and inhibiting muscle breakdown. (Muscle protein synthesis and breakdown happen all the time; the net effect defines whether muscle grows or shrinks.) In this respect, insulin acts in conjunction with other hormones, such as growth hormone and insulin-like growth factor 1.
Reference:
Holt, S.H., Miller, J.C., & Petocz, P. (1997). An insulin index of foods: The insulin demand generated by 1000-kJ portions of common foods. American Journal of Clinical Nutrition, 66, 1264-1276.
Holt et al. (1997; full reference at the end of this post) conducted a classic study of insulin responses. This study has been widely cited, and paints an interesting picture of differences in insulin responses to various foods. But you have to be careful where you look. There has been some confusion about the results because of the way they are often reported in places like Wikipedia and on various Internet sites that refer to the study.
The key thing to bear in mind when reviewing this study is that the amounts of food used were designed to have the same calorie content: 1000 kJ or 240 kcal (i.e., 240 calories). This led to wild variations in the size of the portions that are compared and their weight in grams. Also, some of the food portions are probably not what people usually eat in one sitting.
In Holt et al.’s (1997) study the participants were 41 lean and healthy university students. They were fed 1000 kJ (240 kcal) portions of the test foods on separate mornings after a 10-hour fast overnight. Blood insulin levels were measured at different times within a 120-minute period after each meal. An insulin score was then calculated from the area under the insulin response curve for each food; white bread was used as the reference food.
Part of Table 2 on page 1267 is shown below (the full text version of the paper is linked at the end of this post), just to illustrate the types and amounts of food served, and the macronutrient breakdown for each food. I hope you can see what I meant when I said that some of the food portions are probably not what people usually eat in one sitting. I don’t think it would be hard to find someone who would eat 158 g of beef steak in one sitting, but 333 g of fish is a little more difficult. Fish has a higher proportion of protein than beef steak, and thus is more satiating. The same goes for 625 g of orange, about 6 oranges. Foods that have more fat have more calories per gram; hence the smaller portions served for high-fat foods.

Table 4 of the article is a bit long, so I am providing it in two parts below. AUC stands for “area under the curve”. As you can see, for isocaloric portions of different foods (i.e., with the same amount of calories), there is a huge variation in insulin response. The insulin AUCs are shown on the second numeric column from the left. Also note that the insulin responses (AUC) for white bread varied in different meals. This complicates things a bit, but at least provides a more realistic view of the responses since each participant served as his or her own control.


Look at the third column from the right, which shows the insulin responses per gram of each food, compared with the response to white bread, always shown at the top for each group of related foods (e.g., protein-rich foods). The gram-adjusted response for whole-meal bread is rather high, and so is the glucose response. The gram-adjusted insulin response to potatoes is less than one-third of the response to white bread, even though the non-gram-adjusted glucose response is higher. The insulin response to beef is also less than one-third of the response to white bread, gram-for-gram. Even cheese leads to a gram-adjusted response that is about half the one for white bread, and I don’t think many people will eat the same amount of cheese in one sitting as they would do with white bread.
In summary, insulin responses to protein-rich foods are often 50 to 70 percent lower than responses to equivalent amounts of refined carbohydrate-rich foods. Also, insulin responses to unrefined carbohydrate-rich foods (e.g., potato, fruits) are often 70 to 90 percent lower than responses to equivalent amounts of refined carbohydrate-rich foods.
Why do insulin levels go up in response to dietary protein?
One of the reasons is that insulin is needed for tissue protein synthesis. That is, increased circulating protein (as amino acids) and insulin have a net anabolic effect, promoting muscle growth and inhibiting muscle breakdown. (Muscle protein synthesis and breakdown happen all the time; the net effect defines whether muscle grows or shrinks.) In this respect, insulin acts in conjunction with other hormones, such as growth hormone and insulin-like growth factor 1.
Reference:
Holt, S.H., Miller, J.C., & Petocz, P. (1997). An insulin index of foods: The insulin demand generated by 1000-kJ portions of common foods. American Journal of Clinical Nutrition, 66, 1264-1276.
Sponsored by:
Tuesday, 13 April 2010
Long-term adherence to Dr. Kwaśniewski’s Optimal Diet: Healthy with high LDL cholesterol
This is a study (Grieb, P. et al., 2008; full reference at the end of this post) that I read a few years ago, right after it came out, and at the time I recall thinking about the apparent contradiction between the positive effects of the Optimal Diet and the very elevated LDL cholesterol levels among the participants. I say “contradiction” because of the established and misguided dogma among medical doctors, particularly general practitioners, that decreasing LDL cholesterol levels is the best strategy to avoid cardiovascular disease.
The Optimal Diet is one of the best examples of a healthy diet where LDL cholesterol levels are generally high, in fact much higher than most people are willing to accept as healthy today. (In this study, LDL cholesterol levels were calculated based on the Friedewald equation.)
It is not uncommon to see people concerned about their high LDL cholesterol levels after adopting a low carbohydrate diet. (A low carbohydrate diet is, generally speaking, a high fat diet.) This study shows that this is a rather common thing, and also that it is not something that those who experience it should be too concerned about. To be convinced of this, one can always do a VAP test (see this post for a link to a sample VAP test report) and check his or her LDL particle pattern.
The study presents the Optimal Diet as the Polish equivalent to the Atkins diet. It states that the Diet’s main characteristic is maintaining the proportion of proteins:fat:carbs. in the range of 1:2.5-3.5:0.5, with no restriction on the amount of food consumed. In fact, as you will see in this post, more than 70 percent of the calories consumed by the study participants came from fat.
Easily digestible carbohydrate-rich foods are not part of the Optimal Diet. More specifically, the following foods were listed as not being allowed in the Optimal Diet: sucrose, sweets, honey, jam, white rice, bread, starches in general, beans, potatoes (only in small amounts), and sweetened drinks. Also, the Optimal Diet is definitely a low carbohydrate diet, but not what is often referred to as a "very low carbohydrate diet". In this study, the typical carbohydrate intake per day was around 60 g.
Thirty-one healthy people participated in the study, 17 women and 14 men. The average age was 51.7 (standard deviation: 16.6). They had self-reportedly adhered to the Optimal Diet for at least 1 year prior to the study; the average period of adherence was 4.1 years (standard deviation: 1.9). So, the vast majority had been on the diet for more than 2.2 years, about half for 4.1 years or more, and about one-sixth for more than 6 years. (Check this post if you want to know how these figures can be calculated based on the average period of adherence and the standard deviation.)
The table below (click on it to enlarge) shows anthropometric and physiologic characteristics of the participants. Note that longer adherence to the Optimal Diet (right end of the table) was associated with lower systolic and diastolic blood pressure, as well as lower body mass index (BMI). (It was also associated with lower height and BMR, so I am guessing that more women tended to be long-term adherers than men.) Most of the participants had BMIs in the normal range, with only one in the obese category. That was a 43-year-old man who followed the diet for 1.5 years; he had a BMI of 34.1.
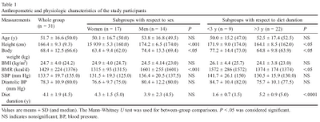
The macronutrient distribution of the Optimal Diet is shown on the table below (click on it to enlarge), as followed by the participants. As you can see, protein intake was not that high; about 53.9 g per day on average for men, a bit less for women. Note the percentage of calories from fat: more than 77 percent for men and 72 percent for women. Given the BMIs just discussed, one can safely say based on this that eating a lot of fat did not make the participants fat.

The table below (click on it to enlarge) has some interesting health markers. Note that free fatty acids (FFAs) were elevated. This is to be expected, as these folks were burning fat for energy most of the time, and not as much glucose. The FFAs are not really “free”, but bound to a protein called albumin, which is abundant in human blood. FFAs yield large quantities of adenosine triphosphate (ATP), the main energy “currency” used by the body.
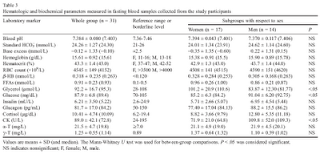
These levels of FFAs are also usually associated with mild ketosis, where ketones are produced by the body and used for energy. Unlike albumin-bound FFAs, ketones are soluble in water, and thus circulate freely through the blood. The mild ketosis experienced by the participants was possibly to the point where ketones showed in the urine. The article mentions this, and provides a measure of beta-HB (beta-hydroxybutyrate, a ketone body), which is elevated as expected, but does not provide urine or other blood ketone measures (e.g., blood acetone levels). Also note the fairly healthy fasting glucose levels, slightly higher in men than in women, but fairly low overall. Fairly healthy insulin levels as well; at the high end of what Stephan at Whole Health Source would recommend, but still significantly lower than the average insulin level in the U.S. at the time of the article's publication.
Finally, the table below (click on it to enlarge) shows lipids and a few other measures. Total cholesterol was on average a bit more than 278 mg/dL. LDL cholesterol was a bit higher than 188 mg/dL on average; high enough to make most doctors cringe today. Based on the means and standard deviations provided, we can estimate that about 16 percent of the participants had LDL cholesterol levels higher than 228.1 mg/dL. About 2.5 percent of the participants had LDL cholesterol levels higher than 268 mg/dL. And this is all after adhering to the diet for a relatively long period of time; even higher LDL cholesterol levels might have occurred right after adoption.

Yet average HDL cholesterol was a very high and protective 71.6 mg/dL. This high HDL and the relatively low triglycerides suggest a large-buoyant non-atherogenic LDL particle pattern.
Average HOMA(IR), a measure of insulin resistance, was a low 1.35 mU/mmol; strongly indicating, together with the relatively low fasting glucose levels, that the participants were far from being pre-diabetic, let alone diabetic.
Diabetes is a strong risk factor for cardiovascular disease, and many other health complications; much more so than elevated LDL cholesterol.
The Optimal Diet does not seem to be a diet for bodybuilders, but I would say that, overall, Peter at Hyperlipid has chosen a diet that makes some sense.
Reference:
Grieb, P. et al. (2008). Long-term consumption of a carbohydrate-restricted diet does not induce deleterious metabolic effects. Nutrition Research, 28(12), 825-833.
The Optimal Diet is one of the best examples of a healthy diet where LDL cholesterol levels are generally high, in fact much higher than most people are willing to accept as healthy today. (In this study, LDL cholesterol levels were calculated based on the Friedewald equation.)
It is not uncommon to see people concerned about their high LDL cholesterol levels after adopting a low carbohydrate diet. (A low carbohydrate diet is, generally speaking, a high fat diet.) This study shows that this is a rather common thing, and also that it is not something that those who experience it should be too concerned about. To be convinced of this, one can always do a VAP test (see this post for a link to a sample VAP test report) and check his or her LDL particle pattern.
The study presents the Optimal Diet as the Polish equivalent to the Atkins diet. It states that the Diet’s main characteristic is maintaining the proportion of proteins:fat:carbs. in the range of 1:2.5-3.5:0.5, with no restriction on the amount of food consumed. In fact, as you will see in this post, more than 70 percent of the calories consumed by the study participants came from fat.
Easily digestible carbohydrate-rich foods are not part of the Optimal Diet. More specifically, the following foods were listed as not being allowed in the Optimal Diet: sucrose, sweets, honey, jam, white rice, bread, starches in general, beans, potatoes (only in small amounts), and sweetened drinks. Also, the Optimal Diet is definitely a low carbohydrate diet, but not what is often referred to as a "very low carbohydrate diet". In this study, the typical carbohydrate intake per day was around 60 g.
Thirty-one healthy people participated in the study, 17 women and 14 men. The average age was 51.7 (standard deviation: 16.6). They had self-reportedly adhered to the Optimal Diet for at least 1 year prior to the study; the average period of adherence was 4.1 years (standard deviation: 1.9). So, the vast majority had been on the diet for more than 2.2 years, about half for 4.1 years or more, and about one-sixth for more than 6 years. (Check this post if you want to know how these figures can be calculated based on the average period of adherence and the standard deviation.)
The table below (click on it to enlarge) shows anthropometric and physiologic characteristics of the participants. Note that longer adherence to the Optimal Diet (right end of the table) was associated with lower systolic and diastolic blood pressure, as well as lower body mass index (BMI). (It was also associated with lower height and BMR, so I am guessing that more women tended to be long-term adherers than men.) Most of the participants had BMIs in the normal range, with only one in the obese category. That was a 43-year-old man who followed the diet for 1.5 years; he had a BMI of 34.1.

The macronutrient distribution of the Optimal Diet is shown on the table below (click on it to enlarge), as followed by the participants. As you can see, protein intake was not that high; about 53.9 g per day on average for men, a bit less for women. Note the percentage of calories from fat: more than 77 percent for men and 72 percent for women. Given the BMIs just discussed, one can safely say based on this that eating a lot of fat did not make the participants fat.

The table below (click on it to enlarge) has some interesting health markers. Note that free fatty acids (FFAs) were elevated. This is to be expected, as these folks were burning fat for energy most of the time, and not as much glucose. The FFAs are not really “free”, but bound to a protein called albumin, which is abundant in human blood. FFAs yield large quantities of adenosine triphosphate (ATP), the main energy “currency” used by the body.

These levels of FFAs are also usually associated with mild ketosis, where ketones are produced by the body and used for energy. Unlike albumin-bound FFAs, ketones are soluble in water, and thus circulate freely through the blood. The mild ketosis experienced by the participants was possibly to the point where ketones showed in the urine. The article mentions this, and provides a measure of beta-HB (beta-hydroxybutyrate, a ketone body), which is elevated as expected, but does not provide urine or other blood ketone measures (e.g., blood acetone levels). Also note the fairly healthy fasting glucose levels, slightly higher in men than in women, but fairly low overall. Fairly healthy insulin levels as well; at the high end of what Stephan at Whole Health Source would recommend, but still significantly lower than the average insulin level in the U.S. at the time of the article's publication.
Finally, the table below (click on it to enlarge) shows lipids and a few other measures. Total cholesterol was on average a bit more than 278 mg/dL. LDL cholesterol was a bit higher than 188 mg/dL on average; high enough to make most doctors cringe today. Based on the means and standard deviations provided, we can estimate that about 16 percent of the participants had LDL cholesterol levels higher than 228.1 mg/dL. About 2.5 percent of the participants had LDL cholesterol levels higher than 268 mg/dL. And this is all after adhering to the diet for a relatively long period of time; even higher LDL cholesterol levels might have occurred right after adoption.

Yet average HDL cholesterol was a very high and protective 71.6 mg/dL. This high HDL and the relatively low triglycerides suggest a large-buoyant non-atherogenic LDL particle pattern.
Average HOMA(IR), a measure of insulin resistance, was a low 1.35 mU/mmol; strongly indicating, together with the relatively low fasting glucose levels, that the participants were far from being pre-diabetic, let alone diabetic.
Diabetes is a strong risk factor for cardiovascular disease, and many other health complications; much more so than elevated LDL cholesterol.
The Optimal Diet does not seem to be a diet for bodybuilders, but I would say that, overall, Peter at Hyperlipid has chosen a diet that makes some sense.
Reference:
Grieb, P. et al. (2008). Long-term consumption of a carbohydrate-restricted diet does not induce deleterious metabolic effects. Nutrition Research, 28(12), 825-833.
Sponsored by:
Sunday, 11 April 2010
The Friedewald and Iranian equations: Fasting triglycerides can seriously distort calculated LDL
This post has been revised and re-published. The original comments are preserved below. Typically this is done with posts that attract many visits at the time they are published, and whose topics become particularly relevant or need to be re-addressed at a later date.
Sponsored by:
Friday, 9 April 2010
Full-fat Dairy for Cardiovascular Health??
[2013 update: a few colleagues and I have published a comprehensive review paper on the association between full-fat dairy consumption and obesity, metabolic health, and cardiovascular disease. You can find it here.]
I just saw a paper in the AJCN titled "Dairy consumption and patterns of mortality of
Australian adults". It's a prospective study with a 15-year follow-up period. Here's a quote from the abstract:
Contrary to popular belief, full-fat dairy, including milk, butter and cheese, has never been convincingly linked to cardiovascular disease. What has been linked to cardiovascular disease is milk fat's replacement, margarine. In the Rotterdam study, high vitamin K2 intake was linked to a lower risk of fatal heart attack, aortic calcification and all-cause mortality. Most of the K2 came from full-fat cheese.
From a 2005 literature review on milk and cardiovascular disease in the EJCN:
I just saw a paper in the AJCN titled "Dairy consumption and patterns of mortality of
Australian adults". It's a prospective study with a 15-year follow-up period. Here's a quote from the abstract:
There was no consistent and significant association between total dairy intake and total or cause-specific mortality. However, compared with those with the lowest intake of full-fat dairy, participants with the highest intake (median intake 339 g/day) had reduced death due to CVD (HR: 0.31; 95% confidence interval (CI): 0.12–0.79; P for trend = 0.04) after adjustment for calcium intake and other confounders. Intakes of low-fat dairy, specific dairy foods, calcium and vitamin D showed no consistent associations.People who ate the most full-fat dairy had a 69% lower risk of cardiovascular death than those who ate the least. Otherwise stated, people who mostly avoided dairy or consumed low-fat dairy had more than three times the risk of dying of coronary heart disease or stroke than people who ate the most full-fat diary. This result is an outlier, and also observational so difficult to interpret, but it certainly is difficult to reconcile with the idea that dairy fat is a significant contributor to cardiovascular disease.
Contrary to popular belief, full-fat dairy, including milk, butter and cheese, has never been convincingly linked to cardiovascular disease. What has been linked to cardiovascular disease is milk fat's replacement, margarine. In the Rotterdam study, high vitamin K2 intake was linked to a lower risk of fatal heart attack, aortic calcification and all-cause mortality. Most of the K2 came from full-fat cheese.
From a 2005 literature review on milk and cardiovascular disease in the EJCN:
In total, 10 studies were identified. Their results show a high degree of consistency in the reported risk for heart disease and stroke, all but one study suggesting a relative risk of less than one in subjects with the highest intakes of milk.
...the studies, taken together, suggest that milk drinking may be associated with a small but worthwhile reduction in heart disease and stroke risk.
...All the cohort studies in the present review had, however, been set up at times when reduced-fat milks were unavailable, or scarce.
Sponsored by:
Subscribe to:
Posts (Atom)